Welcome to the Infographic Best Practices Tour!
Interactive infographics are one of our most popular interactive content types. We have guided our customers through the process of creating them, iterating them, and testing elements within them. Through years of research, we have learned what resonates with users and what doesn’t.

The Content
Utilizing the Content to Show Value
A great infographic starts with great content. Let's dive into the elements you should consider when building and strategizing your content for an infographic.
Choose a Compelling Topic
Find a topic your target audience is interested in by asking yourself who, what, and how. Who is the targeted audience? What issues do they have or solutions do they need? How can you better communicate the solutions and connect it with reputable data?
Add a Navigation
Infographics are long, scrollable pages that have a lot of content on them. Make it easier for users to navigate to the topics that are relevant to them by adding in a navigation in the header.
Keep the CTA Prominent
Infographics should be informative and educational but they should also have a goal. Your CTA should be present upon landing and it is best practice to keep it “sticky” so that users can access it easily no matter where they are on the page.
Cite Your Sources
When using facts and figures make sure your sources are reliable and cite your sources. People want to know where you got your data and it makes the information more reputable.
Use a Compelling Title and Description for Sharing
Utilize a compelling title and description for sharing by using the metatags and OG tags inside the creative studio.
Strip Out Unnecessary Content or Elements
To keep users focused on progressing, remove any extra icons, spacing, or text.
It's All About the Visuals
Once you've crafted your content, it's time for design. Let's go through our best practices for creating an eye-catching, engaging design for your infographic.
Keep Visuals Simple and Digestible
The content you decided to cover needs equally compelling visuals to make it stand out. Make those visuals simple and easy to digest, as they need to be able to deliver quick information to the viewer.
Keep Text to a Minimum
When possible, exchange typography for visual representations. Using visual elements to communicate your data will give it extra impact. Best practice is to keep to one or two sentences per fact or data point.

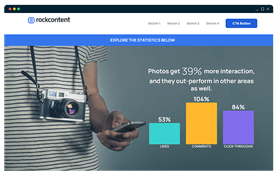
Choose effective data visualization
Choose visuals that represent the data accurately and effectively. Some ideas are charts, graphs, or illustrations. Consider what you’re trying to achieve, the message you’re communicating, and who you’re trying to reach when choosing your visuals.
Create content flow
The best infographics are ones that flow both cognitively and visually. They should be able to guide the reader's eye like a good story, guiding the viewer through a thought process.
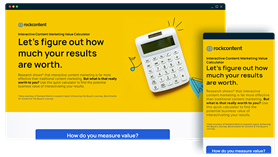
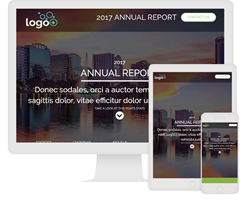
Create visuals that can be scaled back for mobile
The best infographics are ones that flow both cognitively and visually. They should be able to guide the reader's eye like a good story, guiding the viewer through a thought process.
Leveraging Engagement to Collect Data
In an interactive experience, the most valuable piece is the data you'll unearth from your audience engagement. Let's take a look at how you can add interactivity to facilitate meaningful data.
Capture Attention with Animations
Choose visuals that represent the data accurately and effectively. Some ideas are charts, graphs, or illustrations. Consider what you’re trying to achieve, the message you’re communicating, and who you’re trying to reach when choosing your visuals.


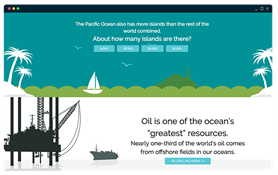
Add Quiz Questions
Test user knowledge about the topic using simple quiz questions.
Quiz
Do you like to interact with quiz?
YES
No
Thank you for participating in our quiz
Make Content Easily Shareable
Give the user accessible options for sharing your content. By adding a "share this" or "Tweet this" component in your infographic, it encourages the user and makes them more likely to share the content.
SHARE THIS CONTENT
Got Additional Assets? Share Them.
Once participants read through the infographic, they will want to learn more. Provide additional assets to keep users engaged and to move them further into the funnel.


Key Takeaways
We learned a lot of best practices in this guide!
Click on the boxes below to reveal the key takeaways from each section.
Click on the boxes below to reveal the key takeaways from each section.

The Content
- Choose a compelling topic
- Add a navigation
- Keep the CTA prominent
- Cite your sources
- Use a compelling title and description for sharing
- Strip out unnecessary content or elements

The Visuals
- Choose effective data visualization
- Keep text to a minimum
- Create content flow
- Create visuals that can be scaled back for mobile

Engagement
- Capture attention with animations
- Add quiz questions
- Make content easily shareable
- Share any additional, relevant assets
Benefits of Infographics
▽
▼
Benefits of Infographics
▲
△
Benefits of Infographics
Learn about your prospects based on their own behaviors. This data can be leveraged during sales calls or for future content opportunities.
▽
▼
Identify pain points
▲
△
Identify pain points
Gather meaningful insights into user pain points and needs by their choices to the questions.
▽
▼
Personalized Experience
▲
△
Personalized Experience
Create a more personalized experience for the user by only showing them content that is related to their needs.
Find an Infographic Quick Start
The Quick Start cloud includes over 150 Quick Start templates to help expedite your interactive content project. Under the infographic category, you will find dozens of Quick Starts that range from easy to difficult. Explore some of our infographic Quick Starts to find one that works for you!
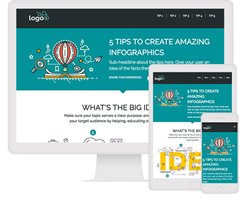
Branded Infographic
The Branded Infographic Quick Start tells the world who your organization is in an engaging and modern way. Animations and interactive elements entice visitors as they scroll through the single-page design. Interesting and compelling details about your product, service, or organization are revealed along the way. And, if you're looking for leads, calls-to-action are built in at the top and bottom of the page.
Gated Infographic
The Gated Infographic Quick Start is the perfect digital experience to share your information with the world, while also capturing important lead information. This gated experience allows the user to scroll through the first section and then requests the user to fill out the form in order to unlock the rest of the content.
View Quick Start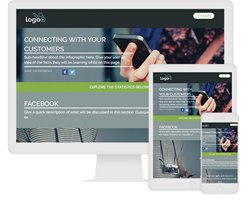
Infographic with Quizzes
This long page infographic is a modern, index-like Quick Start that provides witty, fun ideas for holding attention. It’s got nifty little quizlets built right in as visitors scroll through and participate. And it’s peppered with actionable calls-to-action that deliver a lightbox-based, lead-gen form.
View Quick Start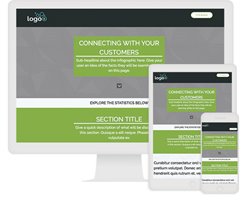
Easy Infographic
The Easy Infographic is one of our “easy” Quick Starts, designed to launch in under an hour, with minimal or no training. This infographic allows users to scroll through five sections about a specific topic. A CTA located in the navigation scrolls the user to the footer in order to complete a simple form.
View Quick StartView Live Example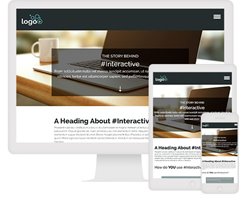
Social Infographic
The Social Infographic includes several sections where you can encourage users to socially share stats, factoids, and important information about a product, service, or business. The long scrollable Quick Start leverages visually subtle animations, reveal tiles, and a video to encourage users to learn more about the product or service.
View Quick Start
Timeline Infographic
The Timeline Infographic is a unique and engaging long page experience that provides an entertaining way to display the timeline of your product, service, brand, or organization. With animations and interactive elements along the way, visitors scroll through and participate as they learn more and create a deeper engagement with your brand. And it’s peppered with multiple calls-to-action that deliver a lightbox-based form for your lead-gen efforts.
View Quick Start
Want more guidance?
We can help you strategize, design, and implement successful interactive content today. Get in touch with us to discover how our services can help your team.

Powered by